Case study

Case study
In 2015, India set out to make its central government more data-driven and transparent. By setting and tracking clear, quantitative goals, the government would be able to measure its progress toward building a better India. Niti Aayog and QCI partnered with us to make this possible by unifying and tracking data for all of India's 89 ministries.

Niti Aayog (National Institute for Transforming India)

Quality Council of India
Government
India
Tracking 89 national ministries for the world's second-largest country is difficult. Trying to do this in a transparent, data-driven way? Nearly impossible.
In 2015, the Niti Aayog and Prime Minister's Office in India realized that there wasn't a good way to evaluate how well India's national ministries were doing. Some ministries didn't set clear goals, and other used qualitative (rather than quantitative) goals that were often difficult to measure.
The Niti Aayog and Prime Minister's Office set out to solve this and make India's ministries more data-driven. They spent 6 months working with every ministry to define clear, measurable goals to assess progress for the next 4 years. But how could they easily track all of these metrics?
The Niti Aayog and QCI partnered with us to create a unified tracking system for all of India's 89 ministries. We created 2 dashboards — one focused on the ministries' granular Departmental Action Plans and one focused on high-level government priorities.
Each quarter, each ministry logs into the former dashboard to update data for each of its deliverables and metrics. Then the Niti Aayog reviews each ministry's progress and leaves comments. Meanwhile, the Prime Minister's Office uses the latter dashboard to get a broader view of progress across key sectors.
Users can view Department Action Plans for each ministry, or they can view multiple plans grouped by theme.
Each ministry's Departmental Action Plans are available in a single page, which makes it easy to assess progress at a glance.
For each theme, officials from the Niti Aayog and ministries can view their joint progress toward quantitative targets.
As Department Action Plans change, officials can add new metrics or action points to all levels of the dashboard.
Officials within the Prime Minister's Office can view the most important targets from each ministry to quickly understand progress across 14 key sectors.
Each sector include key quantitative metrics from each relevant ministry, with the target and current status highlighted for easy comparison.
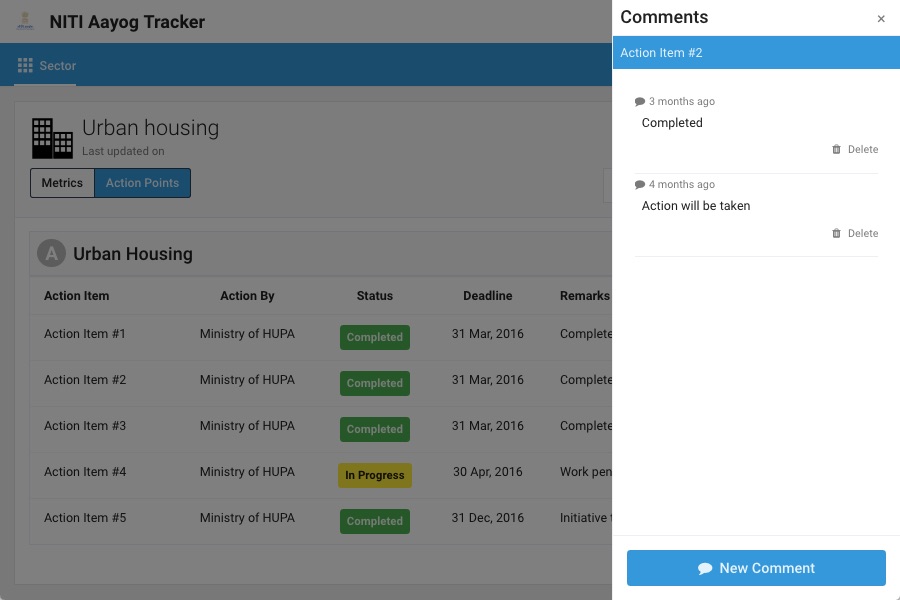
Each sector also show the status of action points — the most important tasks from relevant ministries' Development Action Plans.

On both dashboards, officials from all offices can leave comments for each metric or action point. The comments are helpful for tracking progress, noting changes, and improving communication between the ministries and Niti Aayog.