
Case study
Case study
To jumpstart good governance, the DISHA Dashboard brings data from 42 flagship government schemes to one place for the first time. This helps government officials at all levels explore and assess key government initiatives for any geographic level, at any time period.

Ministry of Rural Development

National Informatics Centre
Government
India
India's data has a geographic problem — each ministry operates on different geographic units and each data set is collected based on different geographic boundaries.
For example, the Ministry of Rural Development measures data down to the gram panchayat level, police data is structured on police boundaries, health data is measured around anganwadis (which are mapped based on population, not geographic boundaries), and so on.
As a result, government data lives in siloes. Different ministries can't unify their data because of geographic mismatches, and elected officials can't track all the data they need across different schemes and sectors at the lowest granularity.
The Ministry of Rural Development and National Informatics Centre partnered with us to help elected officials across India get the data and insights they need.
The DISHA Dashboard helps Members of Parliament (MPs), Members of Legislative Assembly (MLAs), and District Officials track the performance of all major flagship schemes in their districts and constituencies. It unifies data from 42 flagship schemes across 20 ministries, including the National Rural Livelihoods Mission, Pradhan Mantri Gramin Awaas Yojana, and Swachh Bharat Mission - Gramin.
DISHA is a crucial step towards good governance through which we will be able to monitor everything centrally. It will enable us to effectively monitor every village of the country.

Prime Minister
Government of India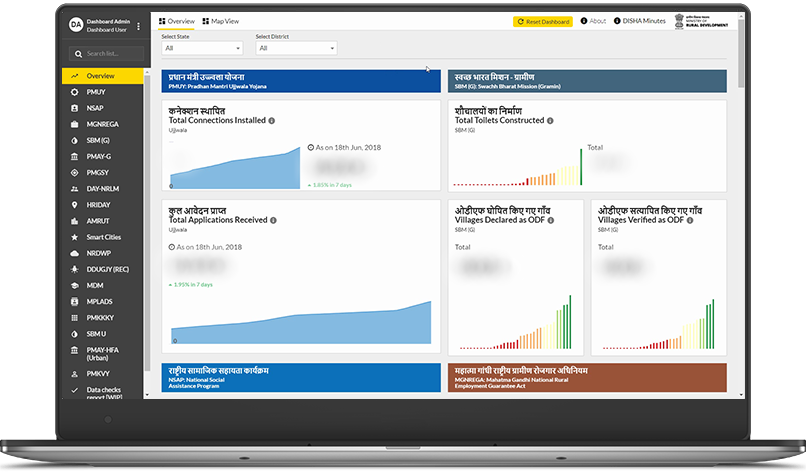
Geography filter
Users can compare and drill-down to states, districts, sub-districts or even gram panchayats.
Scheme filter
Dynamic filtering by specific schemes or views helps users find the exact information they need.
Time filter
Users can step back in time to compare indicators and KPIs on a monthly or yearly basis.
Select indicators make it easy to understand the performance of each scheme and find achievements or issues.
Geographic drill-downs show how each area ranks or compare regions across different indicators.
With a variety of color-coded maps and charts, understanding the reasons behind a scheme's success or failure is a breeze.
Critical KPIs, approved by each ministry, help officials understand the performance of each scheme.
Data for 42 schemes across 20 ministries is finally available and comparable in a single place.
Users can compare metrics and find the top and bottom performing regions at any level — all in a single screen.
Data available at any level — state, district, or even gram panchayat — makes important decisions more granular.
Users can surf through all data quickly and use interactive visualizations to explore key metrics.
The dashboard connects directly to the scheme databases, so the dashboard is updated continuously.