Case study
Case study
As part of the Ujjwala Yojana scheme, the Ministry of Petroleum and Natural Gas wanted to open 10,000 new LPG distribution centers. They partnered with us to find locations with the greatest impact and reach people who needed clean cooking fuel the most.

Ministry of Petroleum and Natural Gas

Bharat Gas

Indian Oil
Hindustan Petroleum
Government
Business
India
In May 2016, the Ministry of Petroleum and Natural Gas launched Pradhan Mantri Ujjwala Yojana, its flagship scheme to ensure access to clean cooking fuel. The scheme aims to provide free LPG (liquified petroleum gas) connections to 80 million women under the poverty line by 2020.
The Ministry of Petroleum and Natural Gas partnered with us to use data to carry out the scheme effectively. We focused on three aspects of the scheme; first, we tackled the problem of where to open new LPG centers.
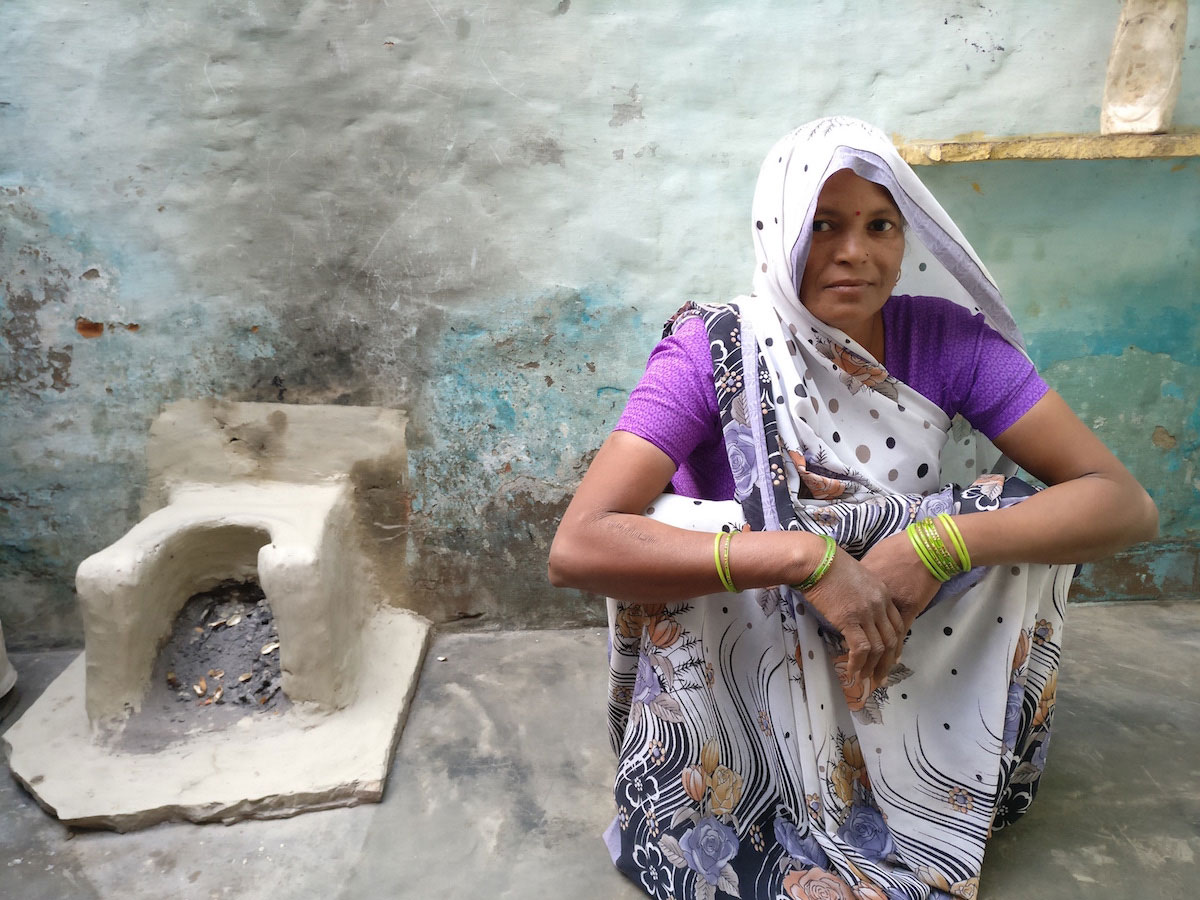
Learn moreIn India, women usually cook on a chulha (clay cook stove) because the nearest LPG center is just too far away. To solve this, the Ministry of Petroleum and Natural Gas partnered with India's 3 oil marketing companies to open 10,000 new LPG distribution centers.
The Ministry's goal was to reach the people who need connections most, rather than opening centers in India's wealthy or urban areas. How could they quickly figure out which locations would reach the most people in need and have the greatest impact?
The Ministry of Petroleum and Natural Gas partnered with us to plan for 10,000 new LPG distribution centers. We used 6.4 million diverse data points to figure out where to open up each new LPG center so it would have the greatest impact on improving access to clean cooking fuel.
We merged sales data for each of India's 17,000 existing distributor centers.
We layered external data with data from our internal repository of 600 external data sources.
17,000 distributors downloaded our app to submit the geocoordinates of their LPG centers.
Since all the data came from different systems, it had to be processed, matched, and geocoded.
Our data scientists created an algorithm to cluster villages and rank potential LPG locations.
Officials used our interactive dashboard to find the best location for every new LPG center.
If we plan and implement a scheme based on mere guesswork and estimates, then certain gaps will show in our decision-making. With the use of numbers, data and technology, we can make important decisions in a matter of minutes. Data is going to become a primary medium for governance in India.

Cabinet Minister for Petroleum & Natural Gas
Government of India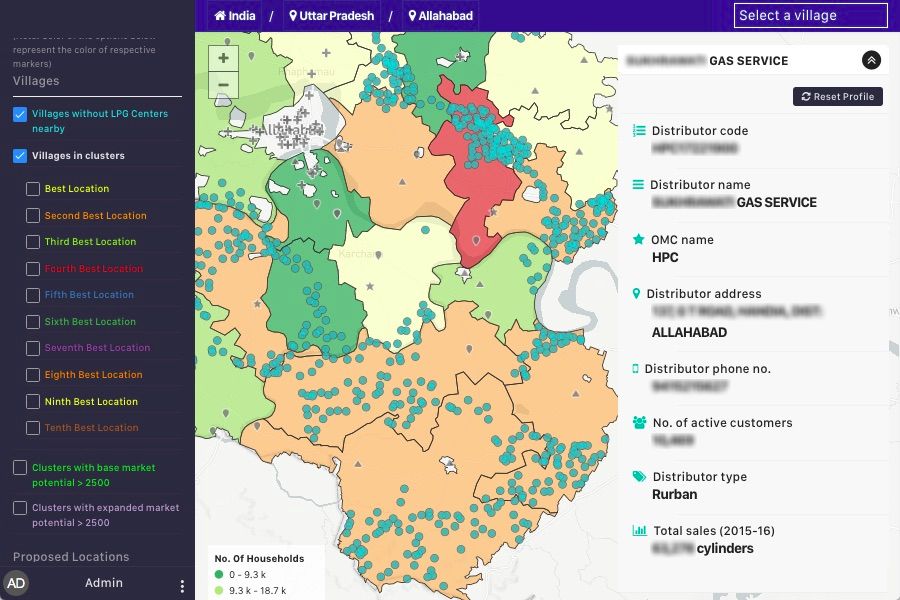
The first step in getting all the data we needed was to understand what existed currently. We extracted, merged, and geocoded data about sales, number of consumers and supply, and more from the scattered internal data systems of India's 3 oil companies.
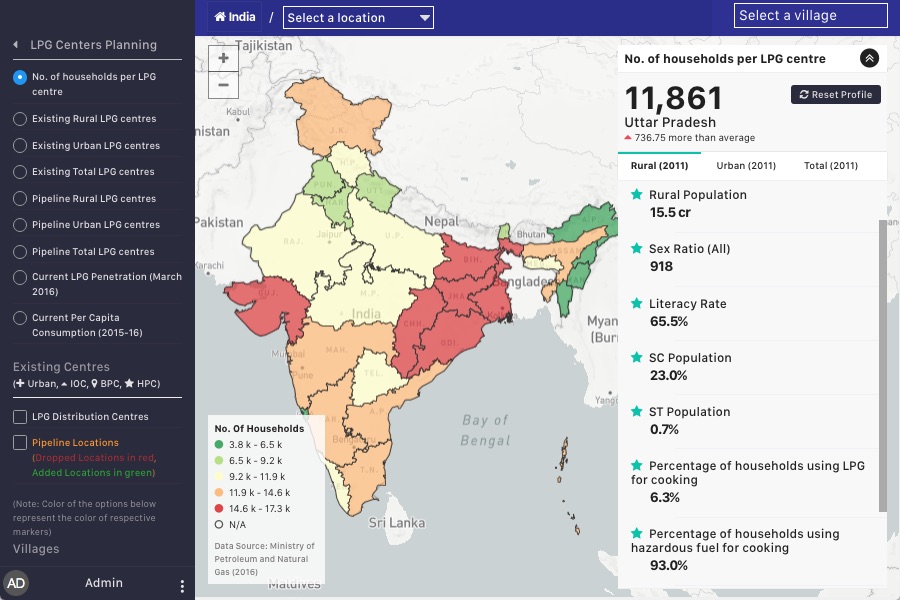
Since sales data only cares about profitability, we knew we had to add external data so we could place centers in the places with the greatest impact. We used public data to map population, affluence, infrastructure, LPG penetration, and a host of other data points.
When we thought we had all the data we needed, we realized we didn’t actually know the location of the existing LPG centers. Within a month, 17,000 distributors downloaded our app to submit their location coordinates from remote corners of the country.
Learn more about CollectOur platform mapped the 17,000 existing distribution centers as the base for our analysis.
Next, we identified villages that were more than 10 km from the nearest LPG center. These were the villages to target.
We then used market-level data to identify which of the underserved villages had enough market potential to support a new LPG center.
With all this data, we finally located the best location for a new LPG center in every district, based on where it will have the greatest impact.


