Case study

Case study
A large FMCG company in India wanted to bring its anti-bacterial soap to rural markets. Since distribution is so difficult in rural India, they needed to target specific blocks with active disease outbreaks. They partnered with us to track the prevalence of 20 different diseases, target sales by sorted sub-districts, and get weekly alerts on real-time disease outbreaks.
In the past decade, rural India has gone from economic insignificance to the promised land for businesses around the world. With an explosion in connectivity, infrastructure and incomes, India's rural market has grown faster than the urban market year on year since 2006.
(That's an 833% increase from today's $12 billion, all in less than a decade.)
(Urban per-capita consumption is 2% points lower and slowing year on year.)
(Home to 68% of India's population, rural markets are a hidden powerhouse.)
With this growth, India's rural markets are rapidly opening up to fulfill rural consumers' appetites for the latest consumer goods.
The FMCG company wanted to use this opportunity to bring their soap to India's growing rural markets and ensure that rural Indians have access to high-quality anti-bacterial soap.


A large FMCG company partnered with us to bring anti-bacterial soap to the rural villages and consumers that need it most and effectively target their marketing campaigns.
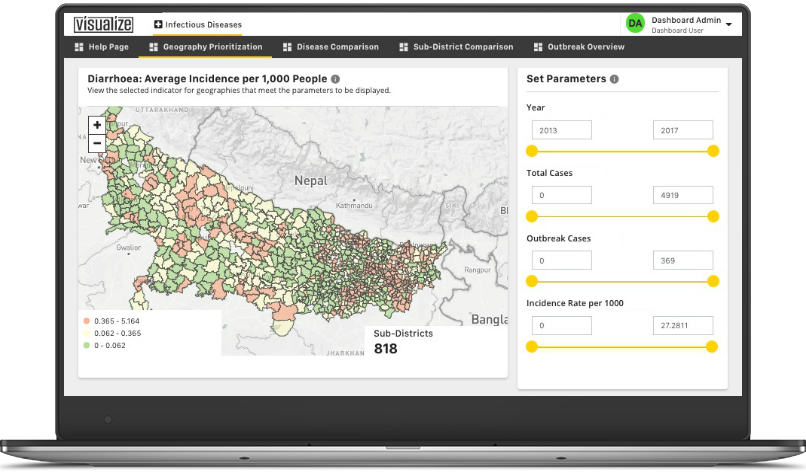
The dashboard uses a variety of public data sources, layered with our proprietary heuristics and analysis, to visualize all aspects of disease prevalence and outbreaks. This helps the company target consumers in specific sub-districts based on incidence rate, cases of different diseases, and other health data.
The dashboard tracks over 20 diseases, including malaria, dengue, typhoid fever, measles, diptheria, tuberculosis, cholera, acute gastroenteritis, and more.
We sourced data from high-quality, granular public data sets to track 20+ diseases on a weekly basis.
Users could compare metrics and trends to prioritize between any two sub-districts — all in a single screen.
We uncovered insightful trends and patterns with proprietary analysis, algorithms and estimations.
Data at any level — state, district, or sub-district — made it easier to make important decisions at any level.
Monthly breakdowns showed how different seasons affect disease prevalence and outbreaks.
Users could surf through all data quickly and use interactive visualizations to explore key metrics and trends.

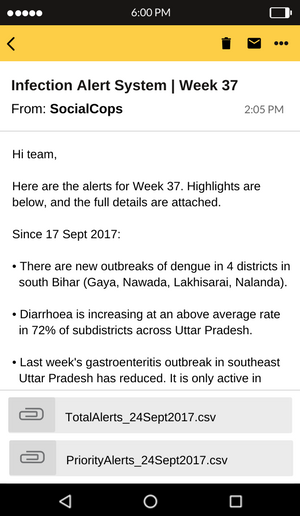
The dashboard automatically generated and sent weekly alerts on disease outbreaks. This was calculated at a block level to make sure alerts were as accurate and actionable as possible.