Case study

Case study
A telecom giant in India wanted to roll out a new product across several cities in India. Instead of launching the product in all of their stores at once, they wanted to start with the stores that would give them the greatest results. They partnered with us to figure out the exact locations that they should target.
For ages, businesses have known that different locations perform differently. Some are fertile ground for new campaigns, while others will endlessly consume money with nothing to show for it. Yet too often, sales and marketing efforts in India are painted with broad strokes — targeting entire swathes of the country or dozens of cities at one time. In a country with so much diversity, this isn't sustainable or scalable.
Today, most businesses today use data to stop guessing and start targeting their efforts at the most local level possible. In many countries, it's all too easy to get incredibly granular data on consumers' movements and preferences through digital tracking.
However, in India, getting granular consumer data is far more difficult. Digital data isn't helpful because of low internet penetration, and India's other sources of granular data are often incomplete, inaccessible, and siloed in systems that don't talk to one another.


We first found the business potential for each store, based on an analysis of nearby points of interest and other demographic and economic data. This helped the company create a strategy of which stores it should target with its new product.

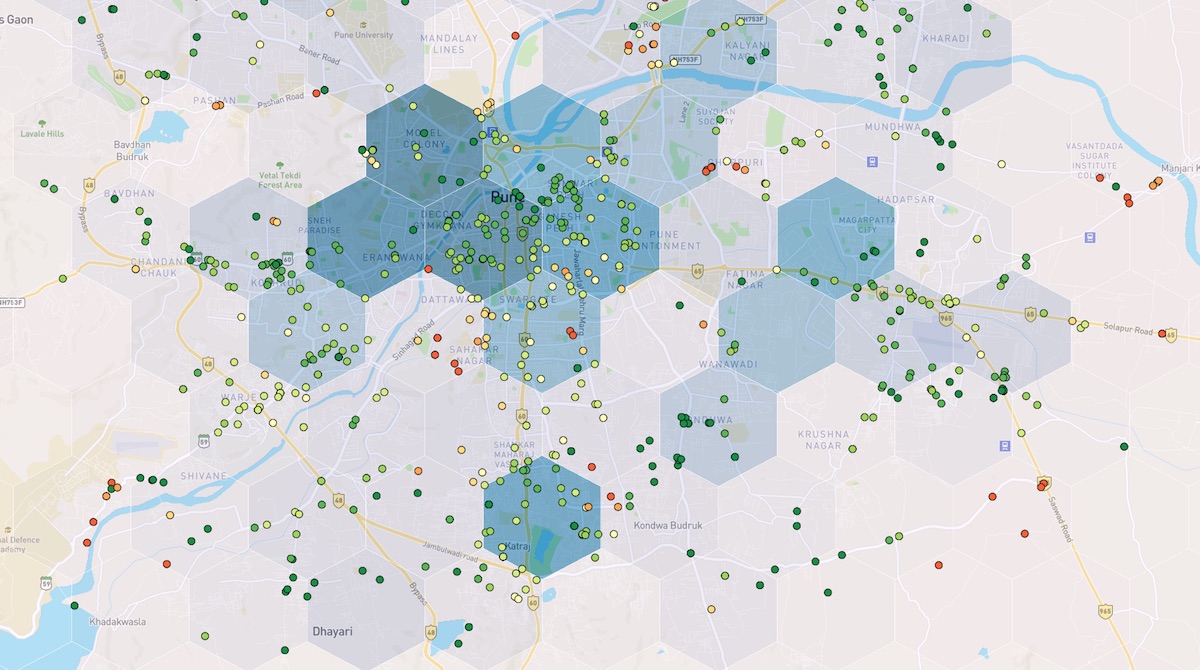
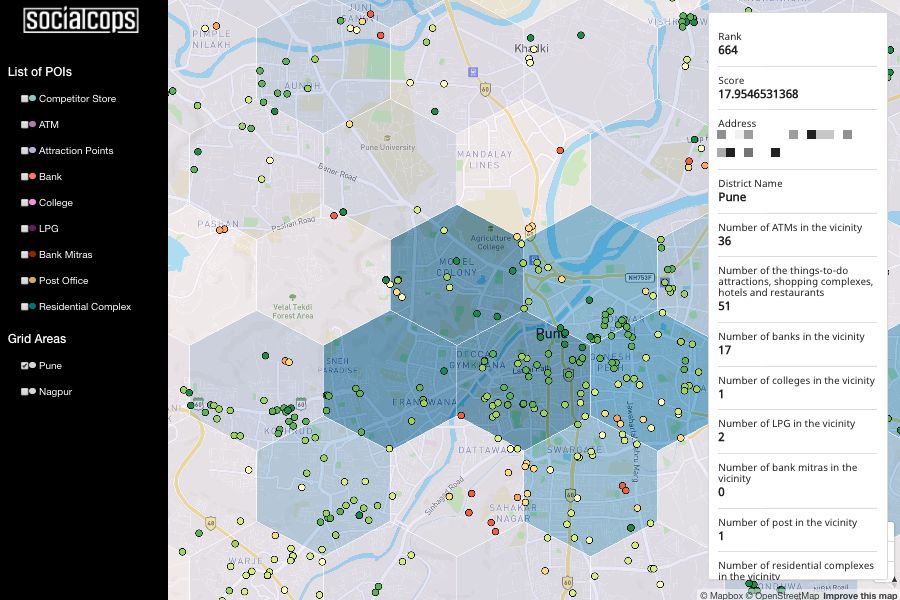
We layered store-level data with a local area-level business potential score, mapped on 2.5 km hexagonal grids. This let us find areas with high business potential but no existing company stores — the perfect locations for expansion.
Layered geographic analysis made it easy to create a cohesive business strategy — all in a single screen.
We uncovered insightful trends and patterns with proprietary analysis, algorithms and estimations.
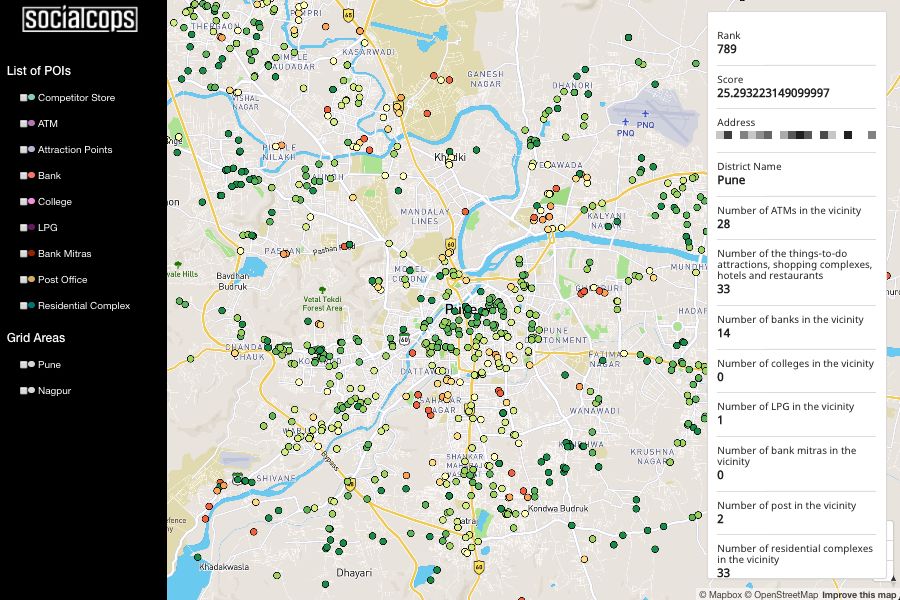
Granular POI data covered competitors' stores, residential complexes, colleges, ATMs and banks, and more.
We converted the company's incomplete retail addresses into full addresses and precise lat-longs.
Viewing data at city or even street level helped the company make important decisions at any level.
Decision-makers could surf through data quickly and use our dynamic map to explore key metrics and trends.

VIDEO DEMO
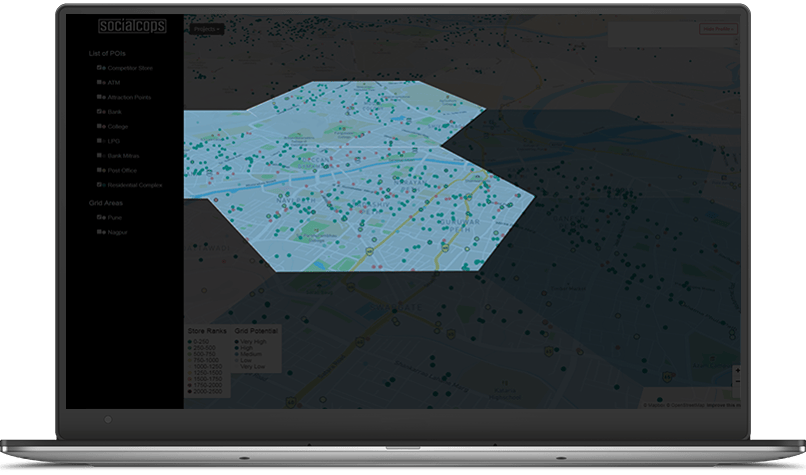
Want to learn more or see this dashboard in action? Check out our 5-minute video demo, where we walk through all major aspects of the case study and dashboard.
Watch the video demo