Case study

Case study
As part of the Ujjwala Yojana scheme, the Ministry of Petroleum and Natural Gas needed to track how effectively LPG applications were being processed. They partnered with us to unify all LPG application data in a unified real-time tracking dashboard.

Ministry of Petroleum and Natural Gas

Bharat Gas

Indian Oil

Hindustan Petroleum
Government
Business
India
In May 2016, the Ministry of Petroleum and Natural Gas launched Pradhan Mantri Ujjwala Yojana, its flagship scheme to ensure access to clean cooking fuel. The scheme aims to provide free LPG (liquified petroleum gas) connections to 80 million women under the poverty line by 2020.
The Ministry of Petroleum and Natural Gas partnered with us to use data to carry out the scheme effectively. We focused on three aspects of the scheme; after tackling the problem of where to open new LPG centers, we set out to track, analyze, and find gaps in the LPG application process.
Learn more
This dashboard was a very useful tool for the important stakeholders to know on a daily basis what’s happening in various parts of the country. If I find from the data that a particular village is not taking refills in the last two weeks, I can immediately send a team and reach out to them to find out why.
Joint Secretary
Government of IndiaHaving more LPG centers is important, but it's equally important to make sure these centers run effectively. This was hard for the Ministry of Petroleum and Natural Gas to assess.
India's 17,00 distributors generated thousands of data points on applications and connections every day — 101 million applications and 72 million connections so far. Moreover, each oil marketing company tracked this data in separate systems.
The Ministry of Petroleum and Natural Gas and India's 3 oil marketing companies partnered with us to bring all data about India's LPG application process into a single place. We continuously pull, merge, and analyze all LPG data, visualizing it in a single dashboard.
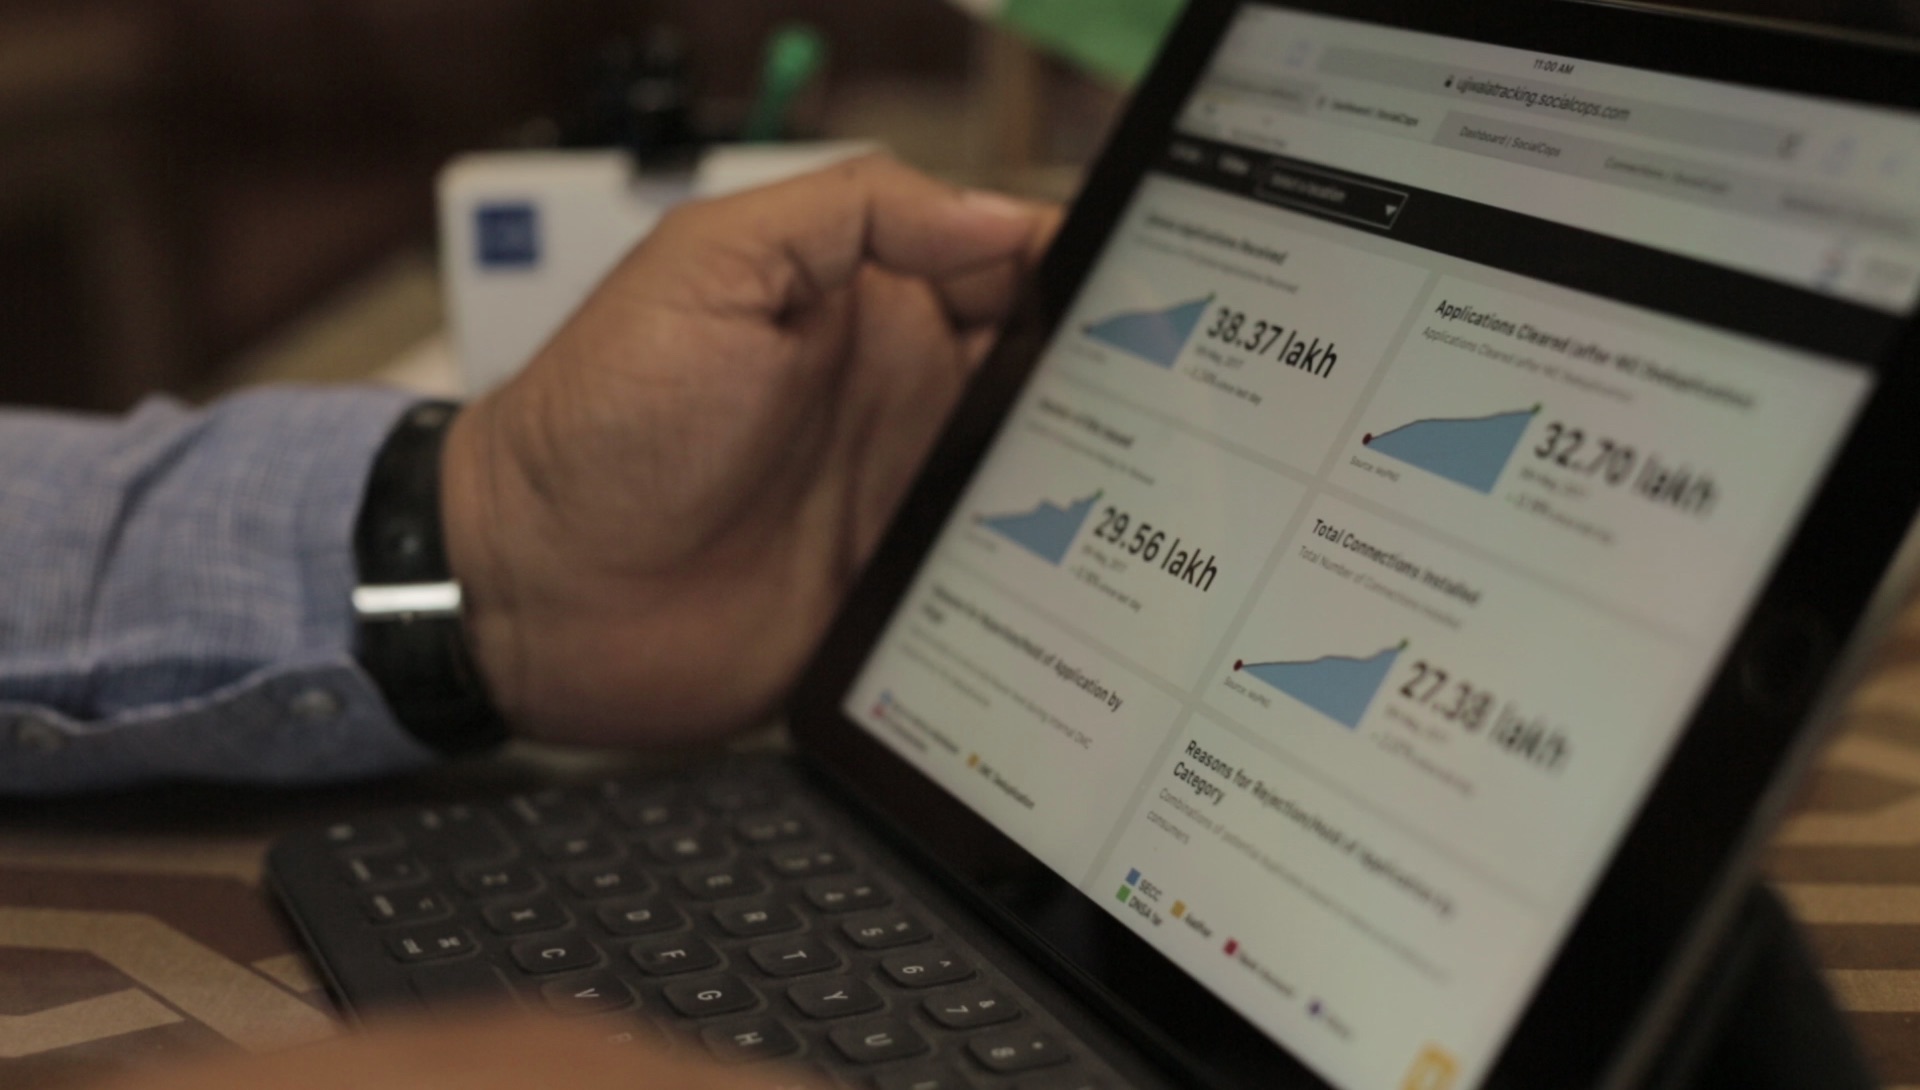
The dashboard covers important high-level metrics, deep dives into important indicators, and a integrated view of the entire LPG application process in a single page. Officials use the dashboard to understand key metrics — how many new applications were received, how many were accepted or rejected, how many women finally had LPG connections in their houses, and more.
We set up pipelines to automatically pull data from all 3 oil marketing companies on a daily basis.
As data comes in, our system automatically cleans and analyzes it before feeding it into the dashboard.
Data insights are visualized to help officials discover where LPG application process are breaking.
SocialCops was instrumental in assessing, analyzing and interpreting the data with high accuracy... For the first time, it was possible for us to assess the scheme on a pan-India level.
Cabinet Minister for Petroleum & Natural Gas
Government of IndiaAll the key metrics about LPG applications that officials need are available through interactive charts and graphs.
Officials can explore the details of high-level metrics to better understand issues and identify problems.
One day, the Ministry of Petroleum and Natural Gas noticed on the dashboard that lots of women were getting rejected by distributors.
After digging into the data, we found that it was happening because those women didn’t have bank accounts — a mandatory requirement for getting a connection. The minister immediately asked this:
The government set up the camps (which help people get bank accounts), bringing together two of India's most important schemes. Now the number of women getting rejected due to lack of bank accounts is nearly non-existent.
Users can drill down on all dashboard widgets from national to district-level data.
The entire LPG application process is visualized in a single page, making it easy to identify where processes are breaking.